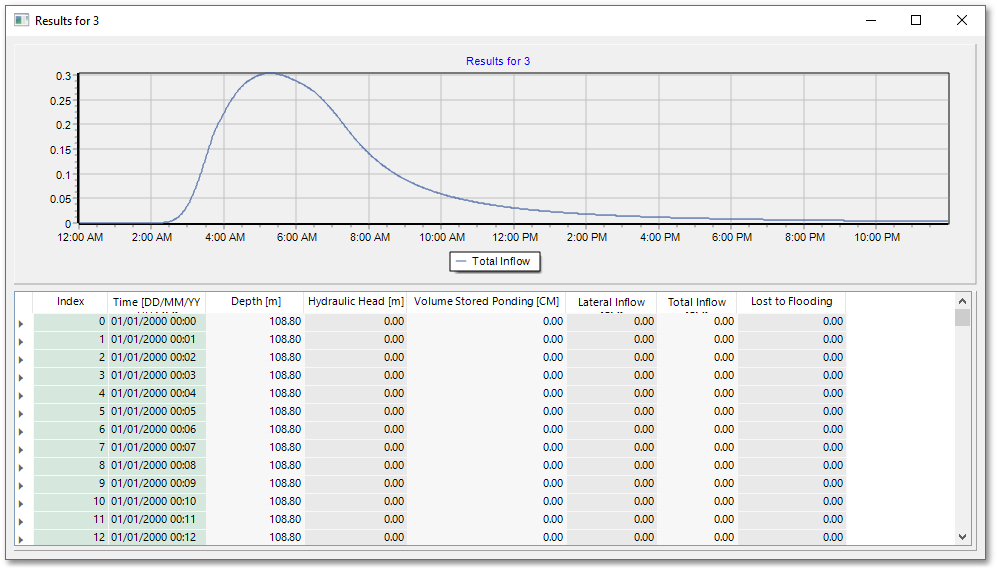
The time simulation results for each Node for the duration of the time simulation can be viewed by selecting the Node to be queried and then selecting Analysis -> Time Simulation -> SWMM - Node Results. This will bring up both a time series graph and a table of the relevant result parameters for the selected Node. The graph can be adjusted by right-clicking inside the graph window and panning.
For Example, this a graph of Inflows to Node 3:
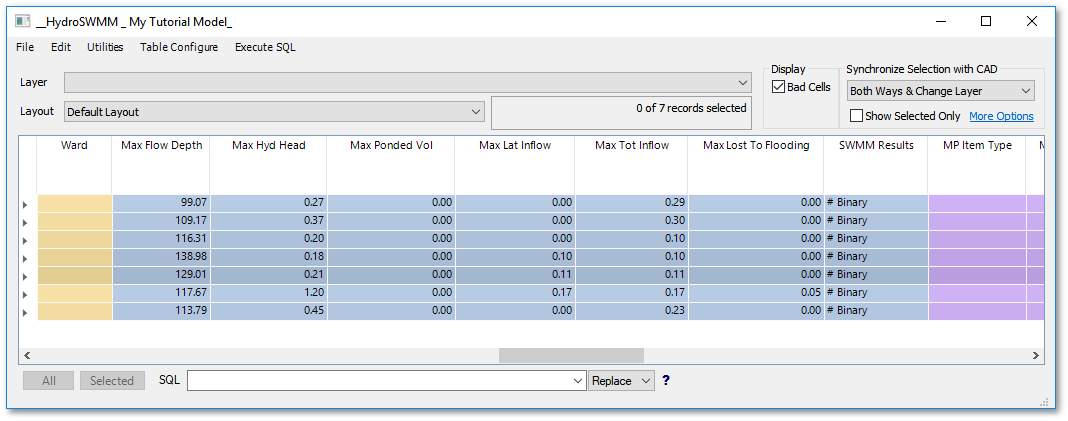
The result maximums are summarised in the relevant tables as follows:
The exact same principle applies to viewing the analysis results for conduits, as well as other hydraulic structures without HydroSWMM