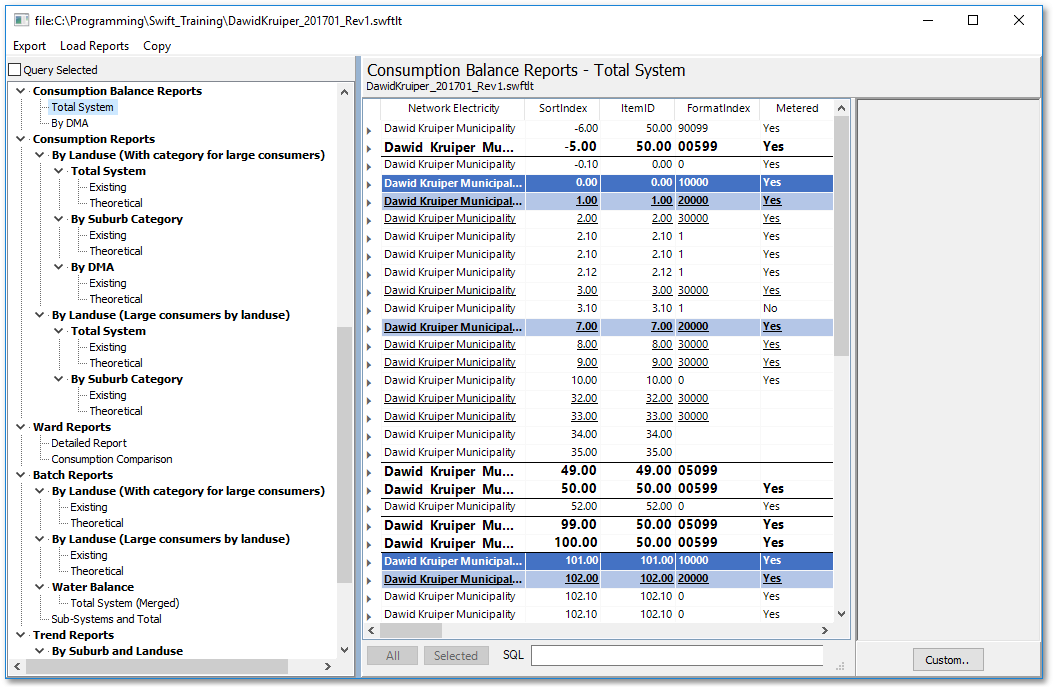
Various summary reports of the model can be compiled via Electricity Data > Electricity Reports. A window will open in which the type of report to generate, can be selected from the scrollable left pane. Notice the numerous reports (By... types) available when scrolling down the left pane (e.g. Batch Reports, Tariff Reports, Trend Reports, Consumption Balance Reports, Consumption Reports, etc.):

When a report type is selected, the main report will be generated and displayed in the centre pane along with optional ancillary reports (such as graphs etc.), which will appear in the right-hand side pane. These graphs can be clicked on, to be displayed in full view in the centre pane (i.e. you can cycle through the generated report views).
A screen-shot is shown below of a generated report showing the Consumption Balance Reports - Total System (without displaying any ancillary graph reports in the right-hand side pane).