Probabilistic Data Analysis can be performed by means of the Probabilistic Method as follows:
1.Select the appropriate Catchment Code from the drop-down list;
2.Select the Calculation Method;
3.Select the Curve Fit Type;
4.Select the total Number of Samples that the Data Set to be used consists of. If this is left blank, it will be assumed that the dataset contains only that which is entered in the following steps.
5.Enter the Return Period;
6.Enter the Time of Concentration (This is not needed for the calculation, only if the user wishes to generate a Time Series from the calculation results, it can be left blank otherwise);
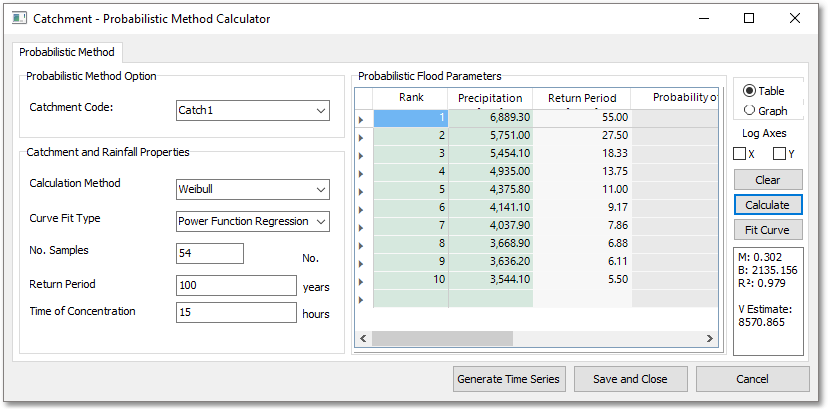
7.Enter the Data Set by either manually entering it into the table, or what is recommended is that the data is pasted in from a spreadsheet (Excel), the data must contain the rank and precipitation/flow volume in increasing order (NB);
8.Click the Calculate Button (This will calculate the Return Period and Probability of Exceedence for each data point);
9.Click the Fit Curve Button (this will fit a curve based on the selected curve fit type, the equation parameters are presented below the Fit Curve Button.
10. Evaluate the goodness of fit by switching to the Graph by using the Graph radio button, if the fit does not follow the data, select another Curve Fit Type -> Calculate -> Fit Curve (The axes can be alternated between normal and logarithmic using the checkboxes).
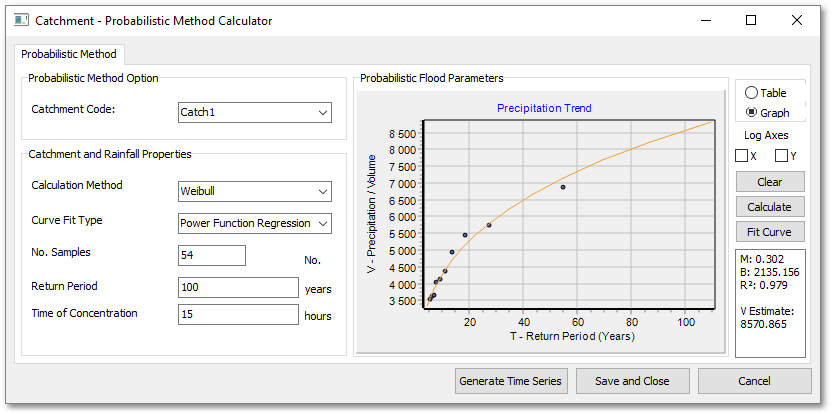
11. If the User wishes to generate a Time Series from the results, the Generate Time Series Button can be clicked to this effect.
12. Should the user wish to save the form data, the Save and Close button can be clicked, which will link the data to the selected catchment. The next time the form is opened, if the same catchment is selected the form will be populated with the saved data.