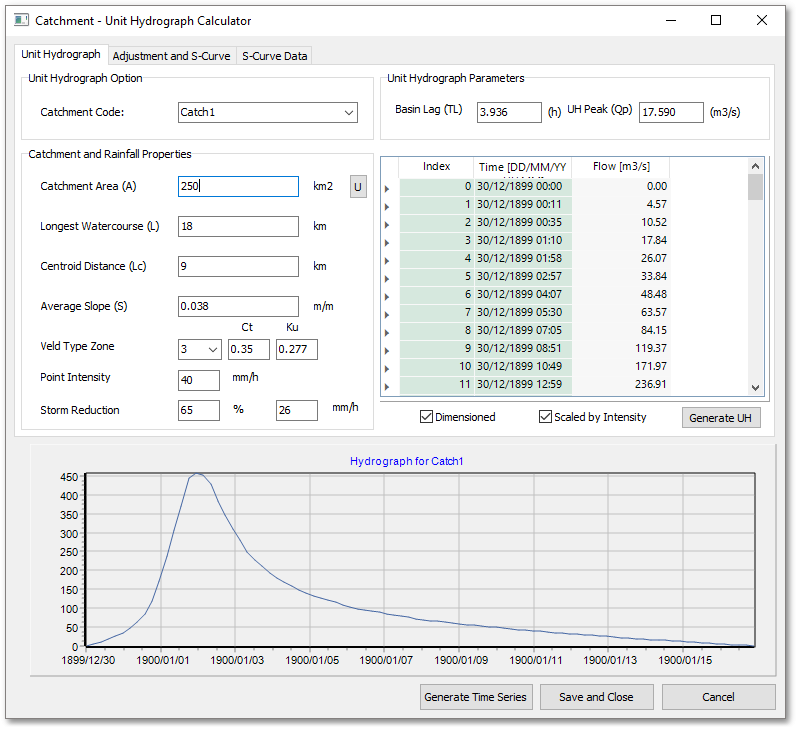
Hydrograph Analysis is supported, based on the Unit Hydrograph and S-Curve approaches. The basic process is as follows:
1.Select the appropriate Catchment Code from the drop-down list;
2.Enter the Catchment Area for the catchment in question (Or update from geometry by using the U button);
3.Enter the Longest Watercourse;
4.Enter the Centroid Distance;
5.Enter the Average Slope;
6.Select the Veld Type Zone from the drop-down box;
7.Enter the Point Intensity;
8.Enter the Storm Reduction Percentage, calculated externally from the appropriate charts;
9.The user can then generate the Unit Hydrograph in the following ways:
- Undimensioned (Both boxes unchecked): The Unit Hydrograph is calculated and plotted;
- Dimensioned (Dimensioned box checked): The Hydrograph is plotted and dimensioned with the Basin Lag and UH Peak;
- Dimensioned and Scaled by Intensity (Both Boxes Checked): The Hydrograph is dimensioned and scaled based on the Storm reduced intensity.
In all cases, the Basin Lag and UH Peak are calculated. The Hydrograph data is presented in the table to the right of the form and graphed below.
10. Should the S-Curve methodology be necessary in order to calculate a hydrograph for an event length that is not a factor of the base hydrograph the user can switch to the Adjustment and S-Curve tab. It must be noted that this requires that the hydrograph generated to be both dimensioned and scaled;
11. Enter the desired Hydrograph Offset;
12. Enter the number of Hydrograph Repetitions of the generated hydrograph;
13. Enter the Desired Storm Duration for which the S-Curve Generated Hydrograph is to be generated for;
14. The Generated Hydrograph can be converted into a time series that will be linked to the catchment by using the Generate Time Series button.
It should be noted that the data entered in steps 11,12 and 13 need to be calibrated by the user in order for a smooth curve to be generated. If the Generated Hydrograph appears wavey or notchy, the Hydrograph Offset likely needs to be made smaller. The number of repetitions should be determined by the shape of the S-curve and should be sufficient to allow the S-curves to flatten out, indicating that equilibrium has been reached. Any negative values after the hydrograph repetitions come to an end can be ignored as it is not taken into account during the generation of the hydrograph.
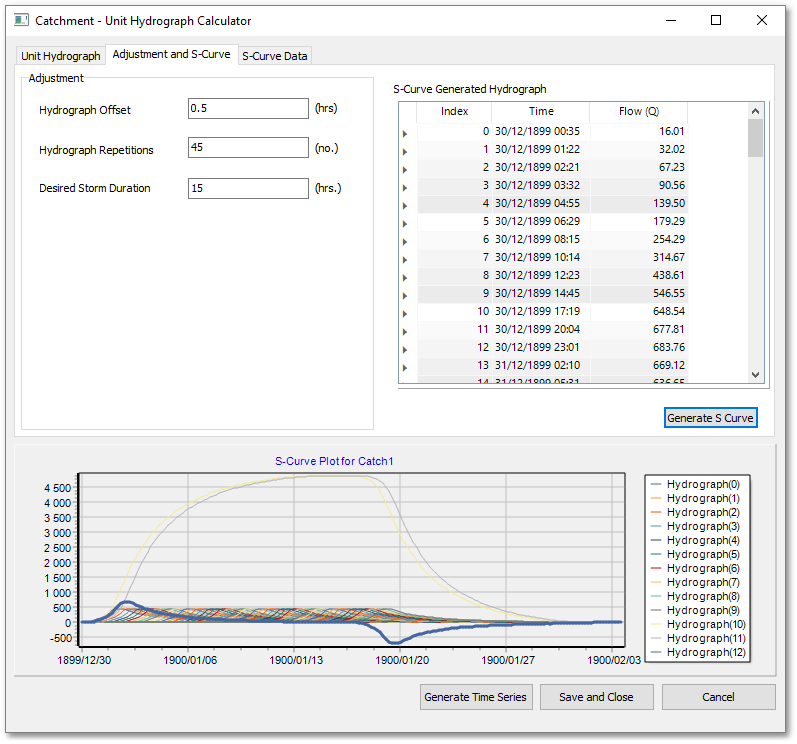
The S-Curve data for each of the repeated hydrographs, s-curves and generated hydrograph can be viewed in the S-Curve Data tab.

15. Should the user wish to save the form data, the Save and Close button can be clicked, which will link the data to the selected catchment. The next time the form is opened, if the same catchment is selected the form will be populated with the saved data.